10. Lesson 1: Create the DOS Application
In this chapter you learn basic procedures for using the Integrated Development and Debugging Environment (IDDE) while building a DOS version of the TML Reader. This lesson teaches you to:- Start the IDDE and load a project
- Edit source code
- Build and run the application
- Create a debugging workspace
- Run the application in debugging mode
Starting the IDDE and Loading a Project
To start the IDDE:First, start the IDDE. If you haven't yet installed Digital Mars C++, please see the Getting Started Guide for installation instructions.
- Double-click on the Digital Mars C++ 16-bit group icon in the Windows Program Manager. (If the Digital Mars C++ 16-bit group is already open, you may omit this step.)
- Double-click on the Digital Mars C++ icon. The IDDE main
window opens at the top of the screen (see Figure 10-1).

[Figure 10-1 The IDDE main window and Workspace toolbox]
Next, you must load the DOS TML Reader project. (A project is a collection of source and other support files from which an executable is generated.) To open the project:
- Choose Open from the IDDE's Project menu.
- Use the Open Project dialog box to find samples\tutorial\lesson1\start\tmldos.prj, located under the directory in which you installed Digital Mars C++.
- Click OK.
In the next section you edit one of the source files.
Editing Source Code
The DOS TML Reader's source code needs a minor addition before compilation. To add the missing lines, you must edit the source code in a Source window.- In the Project window, double-click on display.c.
A Source window opens, showing the contents of the
source file (see Figure 10-2).
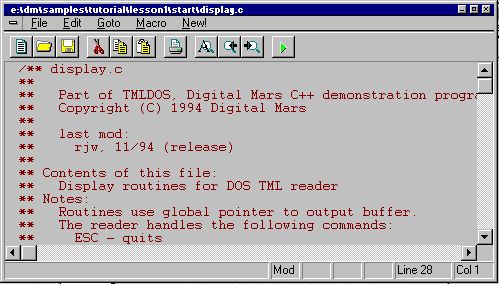
[Figure 10-2 Source window]
- Choose Function from the Source window's Goto menu. The Goto Function dialog box opens.
- Select Display from the Function Name listbox, then click OK. The editor moves to the start of Display().
- Choose Find from the Edit menu. The Find dialog box opens.
- In the Pattern textbox, type LESSON 1.
- Click on Next.
- You should see the following line in the source code:
/* INSERT CODE FOR LESSON 1 HERE! */
Just after this comment, but before the procedure's closing brace, insert the following two lines of code:disp_move(disp_numrows - 1, 0); disp_eeol();
- Choose Save from the File menu.
Building and Running the Application
To build and run the DOS TML Reader:- From the IDDE's Project menu, choose Rebuild All.
The Output window opens automatically. This window informs you of build progress and displays any warning or error messages. If no errors exist, you see the message "Successful build." (You can still work in the IDDE while the build is in progress, because the process of building is multitasked. The Output window can be behind other IDDE windows, even when messages are being written to it.)
- From the IDDE's Project menu, choose Arguments. The Run Arguments dialog box opens.
- Type sample.tml into the textbox and click OK.
- From the Project menu, choose Execute Program.
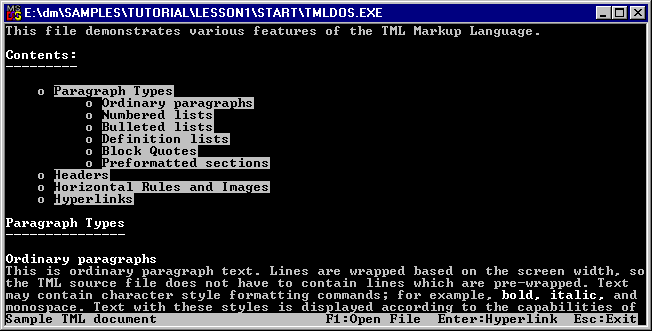
[Figure 10-3 The DOS TML Reader]
The DOS TML Reader is believed to be without any significant bugs. However, most applications have bugs during at least some of their development phase. To help you locate and correct incorrect code as quickly as possible, the IDDE has powerful debugging features.
The following sections show you how to set up a workspace for debugging and debug your source code.
Setting Up a Workspace for Debugging
A workspace is an arrangement of windows on the screen. You can set up several useful configurations of IDDE windows, then switch between them by clicking on workspace names in the Workspace toolbox.The IDDE predefines a workspace named Debugging, which contains a configuration of windows useful for typical debugging sessions. Here, however, we define a new workspace specific to this lesson, to show you how this is done and to avoid disturbing any customizations you may have already made to the Debugging workspace.
To create a workspace for debugging:
- Choose New from the Workspace submenu of the IDDE's Environment menu.
- When prompted for a workspace name, type Lesson1.
- Click OK.
Next, you need to add windows to the workspace. During debugging, the Source window follows program execution, the Function window views a list of functions in a particular program module, the Data/ Object window views program data, and the Call window displays the program call chain.
- To open the Project window, press Ctrl+Shift+P.
- In the Project window, double-click on main.c. A Source window opens.
- To open the Function window, press Ctrl+Shift+F.
- To open the Data/Object window, press Ctrl+Shift+D.
- To open the Call window, press Ctrl+Shift+L.
Arrange the windows the way you want them (one example is shown in Figure 10-4), then choose Save Workspace Set from the Workspace submenu of the IDDE's Environment menu.
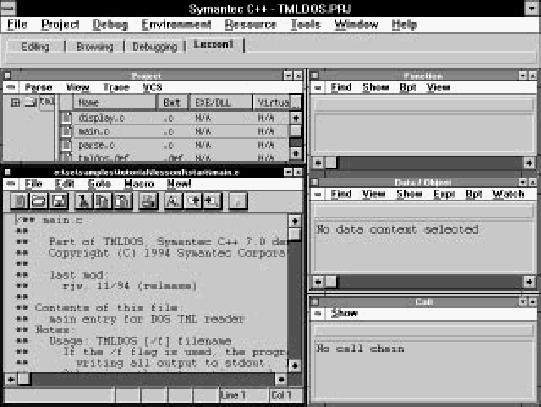
[Figure 10-4 A possible Lesson 1 workspace]
Now that the workspace is ready, you can begin debugging. The following section shows you how to run the application in debugging mode and how to set a breakpoint on a function, how to view program data, and how to step through code.
Running in Debugging Mode
To execute the application in debugging mode, click in the Source window, then choose Start/Restart Debugging from the IDDE's Debug menu. Several things happen:- The IDDE opens a window (the Digital Mars Application Window), in which the application runs. This window may be behind other windows.
- The application is executed to the start of main.
- The Source window changes to debugging mode (see
Figure 10-5). Arrows indicating execution points within
functions, and flags indicating breakpoints are shown in
the left margin. You cannot edit the code while in
debugging mode.
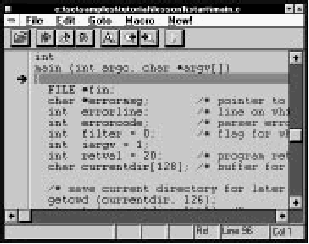
[Figure 10-5 Source window in debugging mode]
- The Project window changes to debugging mode (see
Figure 10-6). The icons next to the source module names
change to indicate their status:
- A bug symbol indicates that the module contains debugging information.
- A small "T" indicates that tracing is enabled in the module.
- A green dot indicates that a breakpoint is set and
enabled in the module.

[Figure 10-6 Project window in debugging mode]
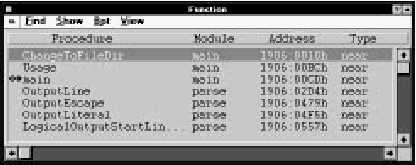
- The Function window is updated to show a list of
functions in the program (see Figure 10-6). An arrow
next to main indicates that it is in the call chain; a
diamond indicates that a breakpoint is set.
[Figure 10-7 Function window]
- The Call window is updated to show the call chain and
execution status (see Figure 10-8).

[Figure 10-8 Call window]
Setting and running to breakpoints
To set a breakpoint on a function and execute to it:- Click and drag display.c from the Project window to the Source window.
- Choose Set/Clear Breakpoint from the Bpt menu. A breakpoint is set at the start of ShowScreen.
- Choose Go Until Breakpoint from the IDDE's Debug menu. The program is executed to the start of ShowScreen.

[Figure 10-9 Call chain to function ShowScreen]
Viewing data
You can view program data using the following commands:- Choose Data from the Show submenu of the Source
window's pop-up menu. The Data/Object window is
updated to show the local data in ShowScreen (see
Figure 10-10).

[Figure 10-10 Data/Object window showing local data]
- In the Call window, click on main, then choose Data from the Show menu. The Data/Object window is updated to show the local data in main.
- Choose Local/Global Data from the Data/Object window's View menu. The Data/Object window is updated to display global data accessible in the current module. Choose Local/Global Data again to resume display of local data.
Stepping through code
To step through the source code line-by-line:- Choose Step Into from the IDDE's Debug menu (or press F8) seven times. The IDDE executes seven lines of code. The seventh step takes execution into ShowLine; at that point the Call window adds ShowLine to the call chain, and the Data/Object window is updated to display the function's local data.
- Choose Return from Call from the IDDE's Debug menu to execute the rest of ShowLine and return to the calling function.
- Choose Step Over from the IDDE's Debug menu (or press F10) several times. The IDDE executes some lines of code in the function, but it does not step into subroutines. ShowScreen is in a loop that writes lines to the screen one-by-one. The results appear in the Digital Mars Application Window.
Running to the end
To execute the rest of the program, ignoring breakpoints, choose Go Until End from the IDDE's Debug menu. Bring the Digital Mars Application Window to the front and test the program as usual. You can press Alt+Ctrl+SysRq to break to the debugger, or let the program terminate before resuming your debugging session. (In the DOS TML Reader, you must press Escape to end the program.)Ending the debugging session
To exit debugging mode, choose Stop Debugging from the IDDE's Debug menu. You can do this at any time during debugging; you don't have to choose Go Until End first.In this chapter you have learned how to start the IDDE, load a project, edit source code, build and run the application, and run in debugging mode. These are the fundamental tasks you perform repeatedly as you develop your own applications, whether you are developing in C or C++, for DOS or for Windows. In the following lessons, you learn about the IDDE's more advanced features, many of which are designed specifically for Windows application development in C++.


